At Harford Technical High School, I was enrolled in the Computer Aided Design and Drafting program to learn technical drafting, architecture, 3-D modelling & animation, etc. both by hand and using CAD software such as Autodesk AutoCad and Autodesk 3ds Max. Shown on the right are some of the results of using AutoCad in my studies.

During my Senior year, I also completed CAD drawings for the instructor of the Welding program to be used for the various projects in that program. These involved creating 3-D models to the exact specifications of the instructor and adding the necessary welding symbols/instructions and dimensions.


This project took place during the 2019-2020 academic year and was cut short due to Covid-19. The video shown below is the result of creating most of the 3-D models in AutoCad then animating and rendering the motion mechanics and visual effects in Autodesk 3ds Max. The project was unable to be fully completed due to Covid-19, but the clips rendered and created were put together to create the movie below.

The goal of this project was to create a product marketed to college students to aid in stress relief by directing students’ attention towards a smaller item as opposed to schoolwork. This task was achieved by creating a desktop toy composed of a laser cut pieces of wood for a lightweight and cheap product that was fun to both assemble and use. Multiple designs were created to satisfy the various metrics set for the project, such as a high reported sense of enjoyment, low assembly time, reduced wasted material, etc. The final design chosen based on maximizing these metrics and performing several design iterations is shown below.


The final design was created by myself, including creating all of the 3-D models in SolidWorks as shown above. Each of the 24 pieces used in the design are cut from a single sheet of pine wood (roughly 124 sq. in.) and assembled by the user. As the car rolls forwards (by being pushed by the user), a gear system attached to the back axle causes a light on top of the car to spin. This gear system also causes the driver side door to swing open and close by utilizing a four bar crank-and-rocker linkage system. The overall product did not meet the target metrics but minor dimensional changes can fix this issue.
This cradle-to-grave life cycle inventory was carried out to study the life cycle processes and their respective component features for two products: hardwood and linoleum flooring. In evaluating these inputs and outputs for each life cycle stage of the products, a brief evaluation of the environmental risks posed was performed to determine which product alternative is more sustainable. The final report was prepared for the University of Delaware Sustainability office to weigh the sustainability of hardwood flooring and its alternative, linoleum flooring. Further, this life cycle inventory was directed to the consumer market intent on home ownership in which these products may be considered for purchase. By reviewing this life cycle inventory, the sustainability of these products are weighed to inform the consumer of the environmental risks associated with each option without presenting bias to one product or another.


Given the broad scope and varying processes used for both products, the inputs and outputs were broken up into the following categories for analysis: wood materials, non-wood materials, and energy use (inputs), as well as wood waste, energy output, and carbon emissions (outputs). It was found that, as expected, linoleum flooring was more sustainable than hardwood floors. The main contributing factors for this are the large amount of carbon emissions created during the production and material gathering for hardwood floors, and the more sustainable materials used across all life cycle stages. Linoleum floors were found to have a higher energy use in manufacturing, but not enough to exceed to carbon emissions caused by hardwood floors.
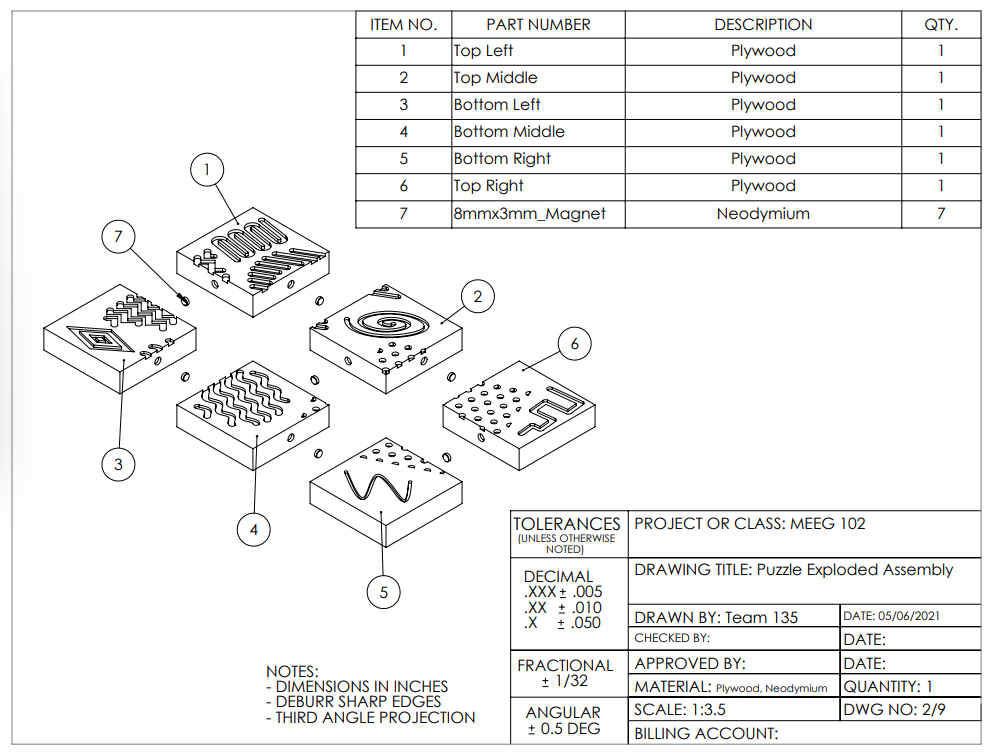
The scope of this project was to create a novel wooden puzzle toy for Melissa and Doug® which is educational and builds on association and critical thinking skills for children, aged 10 to 20 months old. This was determined by a pre-assigned target age range, and allowed our group to decide that a critical thinking puzzle toy was the best product for the market after initial benchmarking and research. The product must meet Standard Consumer Safety Specifications for Toy Safety (ASTM 963-11), not exceed 15 lbs gross weight, fit within a 24" x 24" x 24" space, and also be affordable, aesthetically pleasing, and appeal to the potential end users. The final design chosen was created by myself including all CAD models in SolidWorks; these are shown below.


The design features five inter-connecting planar pieces which together form a cube. On the face of each cube are CNC cut patterns depicting different scenes targeted to engage the childs pattern recognition skills and critical thinking to assemble the pictures together. The toy has the added benefit of being multipurposeful--if needed, the parent can give the child just three blocks to allow the child to solve one flat puzzle instead of a 6 sided cube. On the interior faces of the cubes are magnetic studs to assist in the assembly. All corners are rounded to comply with the necessary metrics.
In constructing the design, issues arose which required a rapid iteration process to simplify the design considerable. My team was able to come up with the design shown below which was the second version of the design, CAD models created by myself.

In this design, like the puzzle cube, various wood pieces are combined to form patterns and shapes which span across multiple pieces. This design can be made by much simpler manufacturing processes with the cost of being less complex or critically engaging. To combat this, the patterns are CNC cut into the wood to give the added benefit of texture association to the design to facilitate touch and sight connections for these textures. Design validation was conducted after manufacturing the toy and found that the design satisfied all project constraints, weighing just 1.14 lbs. Professional feedback from a child development expert evaluated our product to be best suited for children 12-30 months old and as such, the design is likely not suitable for the target age group. A total cost of $15.86 placed the toy within the range found with other benchmarked products.
This project was a dynamical analysis of a football in flight being subjected to non-moving air resistance. The dynamics were solved for using dimensionless variables (X and Y) to create a system of ordinary differential equations. A python script was written by myself to solve this system using the fourth order Runge-Kutta method which produces the graphs below.

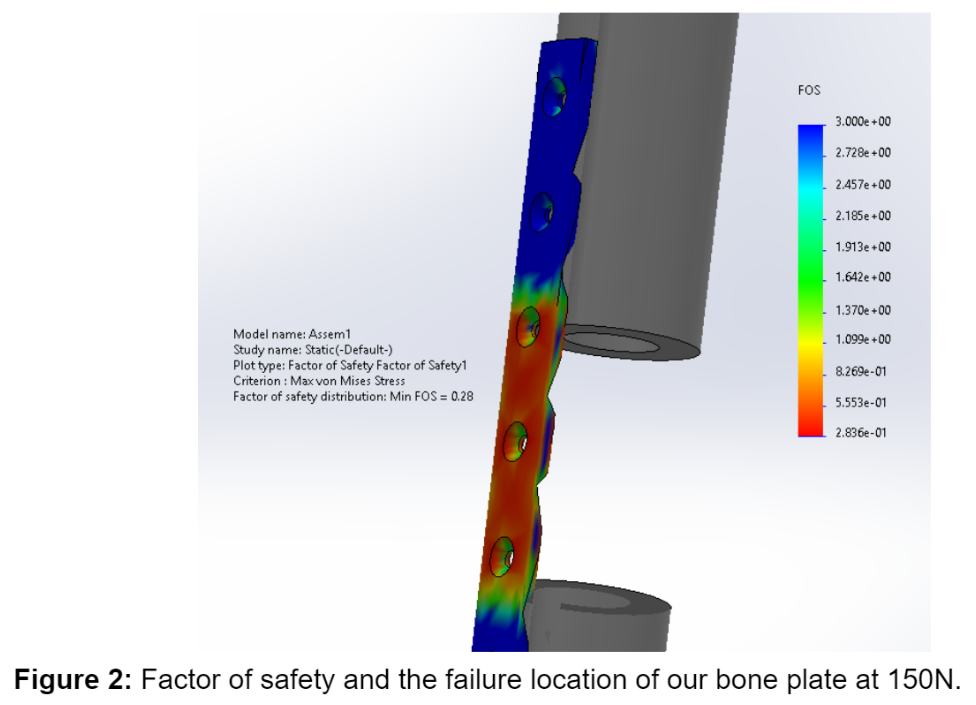
This project aimed to design a fracture plate that can repair bone fracture. The plate is made of a small 160mm x 15mm x 4mm metal bar which attaches to both fractured pieces of a femur and is designed to be a low contact dynamic fracture plate. The final design features 7 holes to secure to either fractured femur piece with small shallots carved in the plate in between each of the holes. This design was created to be strong against compressive bending while also limiting the surface contact area to prevent fracture.


Design validation was conducted by performing theoretical analysis with SoldiWorks Finite Element Analysis (FEA) as well as destructive testing using a hydraulic press testing chamber. The results of both of these tests are shown below. Initial FEA performed suggested the design to fail on the top surface near the middle of the plate when subjected to a 150N compressive force; a minimum factor of safety is found to be 0.28. The shallots are able to cause the fracture to occur in the intended direction as well. Through destructive testing, a yield strength of 4.20MPa is found with an ultimate tensile strength of 6.17MPa (measured at a maximum force of 200.814N).


I performed a basic analysis on the design given the sampled data from destructive testing. When the plate was attached to the femur, colored contact paper was used along with photoshop to determine that 38.6% of the plate was in contact with either femur at all times. The plate also had an estimated Young's modulus based on the stress-strain curve created of 13.9kPa.
The goal of this project was to find the best material for a phone case suitable for a modern smart phone. I performed background research on phones on the market as well as their typical usage and failure occurances which was used to determine that this product can be modelled as a panel in bending from impact forces (being dropped), with objectives to minimize cost per volume and maximize stiffness of the case. After defining a material index, Granta Edupack CES was used to plot the best materials as shown below. Multiple limiting stages were added based on environmental protections, comfort of the user to hold, as well as preliminary calculations to determine the minimum material properties needed to prevent fracture.

The final ranking process was determined by comparing the material index values but also more subtle factors, such as comfort, manufacturing processes, etc. and determined that polypropylene foam (PPf) was the best material. Injection molding was also determined to be the best choice of manufacturing as it can fit the complex shape needed (to add logos, work around the contours of the case, add button/holes, etc.), has a good surface finish, and has the best cost while still being functional. I performed an eco-audit on the top two contending materials (PPf and PVCf) to verify that the material choice is also the most sustainable in terms of carbon emissions and energy consumption. This analysis showed that PVCf had 12% less energy consumption across the entire life cycle, and 15% less CO2 emissions, but the functionality of the PPf greatly outweighed these factors making PPf still the best material.

I performed a cost analysis using the chosen material and injection molding process to estimate that at 50,000 units, a unit price of $1.63 ($2.31 after a 35% mark-up rule-of-thumb) is determined for the product verifying its application for a viable consumer product.
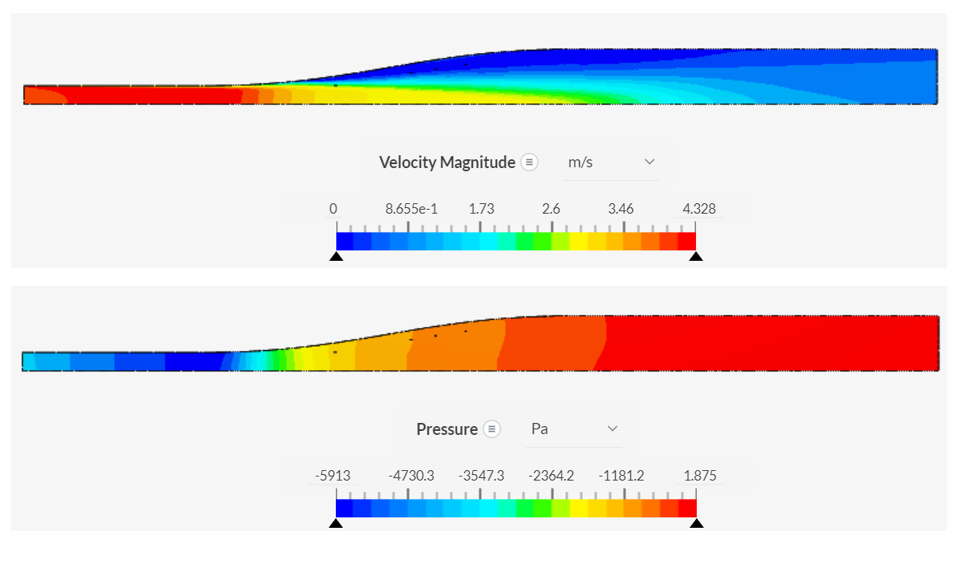
These projects mainly served as a solo learning and exploratory experience for computational fluid dynamics (CFD) using Simscale. The first CFD analysis involved designing a diffuser to minimize fluid head loss, as opposed to a sudden expansion diffuser. Theoretical calculations were performed to find the ideal expected pressure drop across a diffuser by Bernoulli's equation which served as the base measurement. Using Simscale, an internal flow (k-omega turbulence model) simulation is performed across decreasing mesh sizes to create a mesh-independent study that fully converges on a steady pressure drop and velocity profile throughout the diffuser. The results of this are shown below.


As shown in the plot above, the graph reaches a sufficiently refined mesh size and creates the pressure and velocity profiles shown. A loss coefficient for this diffuser is calculated to be K = 0.802 given the large stagnation region near the throat of the diffuser. A new design is created to expand this throat region and try to better mimic the streamline behavior of the fluid to attempt to prevent the turbulent stagnation regions.

In the redesigned diffuser shown above, a reduction in head loss is calculated to be 51.2% which is a significant improvement. The coefficient of loss for this new design is K = 0.394 which verifies the superiority of this design.
Another CFD case study was performed to understand drag on an object subject to external flow. A cube, cylinder, and NACA 0015 airfoil are used to compare viscous and drag forces under turbulent conditions (high Reynold's number flow, k-omega turbulence model). For each object, a mesh-independent study was performed to make sure (1) the system fully converges to steady flow patterns, (2) the residuals of the system all decrease to zero, and (3) the system reaches consistent values with mesh size. The results of each of the simulations are shown below.


A significant result of the analysis shows that theoretical predictions can only be used as an order of magnitude approximation. For the cube, a large stagnation region is created which results in the high drag force and pressure force on par with the expected stagnation pressure. The cylinder created a turbulent recirculatory region behind the object which similarly experience a high level of drag as a result of the stagnation regions. For the airfoil, however, the streamline design prevented almost all turbulence at the boundary layer and as such the large surface area was the main contributor to drag. It is also observed that the design of the airfoil creates a negative drag component from pressure (or Bernoulli) forces and as such contributes to the thrust of the body.
The goal of this project is to create a vehicle speed PID (proportional-derivative-integral) controller for a small electric car for the University of Delaware's scaled smart city (IDS3C) to aid in the study of autonomous vehicles. The car is modelled as having an applied force from the motor with a damping force restricting the motion. A dynamical analysis of the system is performed to create a differential equation for the equation of motion, which is solved using a Laplace transform in the s-domain as shown below for the plant equation. The controller is deterimined to be an arbitrary PID controller. The input value is the desired speed of the car and the output is the true speed of the car, the controller as such determines the force to apply given the error.


Performing such an analysis creates a transfer function of a second order system with two zeroes. This was approximated as a second order system to solve directly for the time domain specifications required. Using the given values, the PID gain values are solved for using these specifications and as such the entire system is known. A simulation of the simulation under a step response is performed in Matlab to verify that these gains will meet the required time domain specifications. After this, the gains were applied to an actual car in the scaled smart city to determine the response to various step responses.


The system was required to have an overshoot of no more than 25%, a settling time of no more than 0.2s, and a steady state error of less than 10% of the desired speed. Based on the experimental data, the system has an overshoot of approximately 33.8%, a settling time of estimated 1.28s, though it does not reach steady state. Although the controller could bring the system to the required values, it does not settle and is too noisy to determine the success.
The objective of this project was to create software to simulate the transcient heat transfer response across a thin rectangular plate subject to several prescribed boundary conditions. For this application, the boundary conditions shown below (left) are used. Several equations were developed using an explicit, two-dimensional finite difference method solution with several non-dimensionalized parameters utilized for iterative analysis. For the implimentation of this software shown below, a 30cm x 30cm x 2cm plate of aluminum is placed in a room at STP conditions, meaning that 2D assumptions are valid.


In order to have a converging solution, a Fourier number fo Fo > 0.25 was calculated from the above equations, setting the optimal time step for simulation results. Convergence was ensured via two methods: mesh size independence and overall heat flux magnitude. The latter set the condition for the maximum simulation runtime by determining the time it took the temperature distributions to reach steady state, or when the average rate of change of the temperature in each cell could accurately be approximated as zero. This analysis was performed across gradually increasing mesh sizes, allowing the simulation to become refined without sacrificing excessive computation time. Once the steady state results were independent of the size of the mesh, and appropriate time steps were given to ensure convergence, the results of the project were created below.

"Effects of Weather on Predicted Motor Vehicle Accident Reports in New York City Using Supervised Machine Learning" by Andrew Smith
Abstract
This project attempts to study the effects of regional weather data on motor vehicle accidents for New York City between the dates of October 12th, 2012 and December 31st, 2015. Correlations between the various weather features will be analyzed with respect to themselves and with the aggregate count for the reported motor vehicle accidents to determine which weather features can be excluded from analysis, and how the general weather trends impact the number of accidents by first order approximation. A machine learning algorithm will be selected, trained, and tested on the labelled data to determine the ability of such an algorithm to predict the liklihood of motor vehicle accidents. The applications for such analysis are numerous, including but not limited to warning drivers of hazardous weather conditions, preparing emergency services for influx of motor vehicle accidents using weather forecasting, determining monetary effects on weather conditions for insurance companies, etc.
Regional weather data for New York City is gathered from Weather Underground for dates between July 1st, 1948 and Decemeber 31st, 2015 [1]. Data is used from GitHub as it has previously been compiled and tabulated--such process is beyond the scope of this report, refer to the referenced source for more information. A tabulated list of all reported motor vehicle accidents in New York City is collected from Data.World and ranges from October 12th, 2012 to April 14th, 2020 [2].
[1] Zoni Nation. (2016). Weather for 24 US Cities. Weather Undergound. Github. Retrieved April 5, 2023 from https://github.com/zonination/weather-us.
[2] City of New York. (2020, October 11). Motor Vehicle Collisions - Crashes. data.world. Retrieved April 5, 2023, from https://data.world/city-of-ny/h9gi-nx95
"Prediction of College Tuition Rates Using Machine Learning Regression Models and Non-Financial Data" by Andrew Smith
Abstract
This study relates the demographic and statistical figures of a university in the United States with its out-of-state tuition cost per student. Features considered for analysis exclude statistics inherently related to financial information--such as cost of room and board, alumni donations, etc.--and instead uses non-financial features such as the annual number of applications, number of enrolled and accepted students, students in the top 10% and 25% of their high school class, full and part time undergraduate populations, percentage of faculty with PhD's or terminal degrees, student-faculty ratio, graduation rate, and whether a school was a public or private institution. The data is gathered from 777 unique universities across the United States [1], and analysis is conducted on 539 colleges which were not considered outliers in any of the analyzed features. Such a study can predict how much a university will cost based on factors about the educational experience of the student body--this can be used to determine which colleges charge more or less than the predicted tuition rate to determine the value of education across the United States.
Linear regression models are trained using these features with multiple regularization models applied. The coefficient of determination is computed for algorithm and measured against a baseline linear regression with no regularization applied. Using non-financial and financial feature sets, and with LASSO and ridge regularized linear regressions, the best performing algorithm was a k-nearest neighbors using the financial inclusive data set, with R^2=0.7039. Without the financial information with the same regression, R^2=0.6972 suggesting that financial information provides relevence to the tuition cost than what is observed with non-financial features. For this analysis, the features with the largest impact on increasing tuition were the number of accepted students, whether a school was a private college, and the number of faculty members with terminal degrees. The features which decreased the tuition the most were the number of enrolled students, the student-faculty ratio, and the number of applications each year.
[1] Gupta, Y. (2019, October 28). US College Data. Kaggle. Retrieved May 2, 2023, from https://www.kaggle.com/datasets/yashgpt/us-college-data
"On the Validity of Rural-Urban Polarization by Unsupervised and Network Clustering of Counties in the United States" by Andrew Smith
Abstract
It is often stated that urban and rural regions of a country become polarized over time with increasing disperities between not only political affliations [1], but also with economic and demographic statistics. For the United States, a very populous nation with the fourth largest land area of any country [2], there may be an exagerated effect given the larger distances between densely populated regions seperated by large suburban and rural areas. However, while the political divide between rural and urban regions of the US has been extensively studied, namely in presidential and gubernatorial election results, there is less research on the validity of dividing the US into two succinct groups [1]. Evidence is therefore needed in determining the effectiveness of various county clusterings of the US based on these aforementioned factors.
Data on county statistics is collected from the United States Census Bureau from 2010 to 2019 [3]. A list of each US county and all counties which share a land border with said county is given by the county adjacency data from the United States Census Bureau as well [4]. The raw data files used for analysis are shown below. This study will perform a clustering analysis of counties in the United States to determine whether the binary view of the US is valid and if it conforms to the rural-urban polarization expected. Data is collected from the US census bureau from 2010 to 2019 and includes economic and demographic statistics for each county only; any political references are ignored for analysis. Clustering will be performed in two batches: unsupervised clustering, using k-means, agglomerative, and expectation-maximization clustering which are blind to inter-county adjacencies; and network clustering, using spectral clustering to have preference to nearby counties. Performance in each computation is measured using an average silhouette score across all clusters. Results indicate that the best clustering performance comes from considering the continental United States as a single cluster and thus provide evidence that a non-binary view of the United States is valid. Apart from political views, there is little evidence that the United States is signifantly different when comparing rural and urban regions, or any subgroup dividing the country for that matter.
[1] Love, Hanna, and Tracy Hadden Loh. “The ‘rural-Urban Divide’ Furthers Myths about Race and Poverty-Concealing Effective Policy Solutions.” Brookings, December 8, 2020. https://www.brookings.edu/blog/the-avenue/2020/12/08/the-rural-urban-divide-furthers-myths-about-race-and-poverty-concealing-effective-policy-solutions/.
[2] “Largest Countries in the World (by Area).” Worldometer. Accessed May 18, 2023. https://www.worldometers.info/geography/largest-countries-in-the-world/.
[3] Whitcomb, Ryan, Joung Min Choi, and Bo Guan. “County Demographics CSV File.” CORGIS Datasets Project, from Austin Cory Bart, Dennis Kafura, Clifford A. Shaffer, Javier Tibau, Luke Gusukuma, Eli Tilevich, November 5, 2022. https://corgis-edu.github.io/corgis/csv/county_demographics/.
[4] National Bureau of Economic Research. “County Adjacency.” NBER, from U.S. Census Bureau, May 8, 2017. https://www.nber.org/research/data/county-adjacency.
The goal of this project was to design a pinewood derby car with the assistance of computational fluid dynamics software to create a car with low drag and high lift. The success of the car was measured by computing the theoretical time the car would take to reach the finish line. For this, the track was modelled as a downhill slope and a flat runway which each had their respective equations of motion. Considering an object in freefall with aerodynamic phenomena neglected for the downhill section, and an object accelerated by drag and lift in the runway section, the equations below are found.

A fourth-order Runge-Kutta ordinary differential equation solution method was imployed in Python in order to estimate the time the car would take to finish the flat section of track based on the vehicle properties, the initial speed, and the drag and lift coefficients.
The vehicle was designed using Onshape and is called the "Orca5" based on the shape of the body and design iteration. With the added mass (not pictured), the center of mass of the vehicle was placed at a position 92.84% of the length of the vehicle downstream from the nose in order to maximize the speed at the end of the ramped portion of track. This center of mass location, combined with a far rear axle position, ensures the design is statically balanced when in motion. Using SimScale to measure drag and lift forces occuring on the vehicle from pressure and viscous sources, the aerodynamic coefficients were found to be CD = 0.009098 and CL = 0.006198.


The total track time for this design using the specifications of the track given came to be 1.6924s which earned a position as one of the top three designs across all competitors. Featured below are the top three fastest car designs across all submitted entries with the Orca 5 design shown on the left.

This project featured a class-wide competition for the best aerodynamic glider design. Success of the glider was divided into three seperate categories: endurance (total duration of flight), range (maximum horizontal distance travelled before landing), and altitude (maximum altitude reached during flight). Each glider was subject to several constraints such as the initial take off conditions (35 m/s takeoff at 20m height with 0deg angle of attack), body geometry (fixed fuselage and tail size and weight), and vehicle boundaries (maximum allowable wingspan width of 7m).
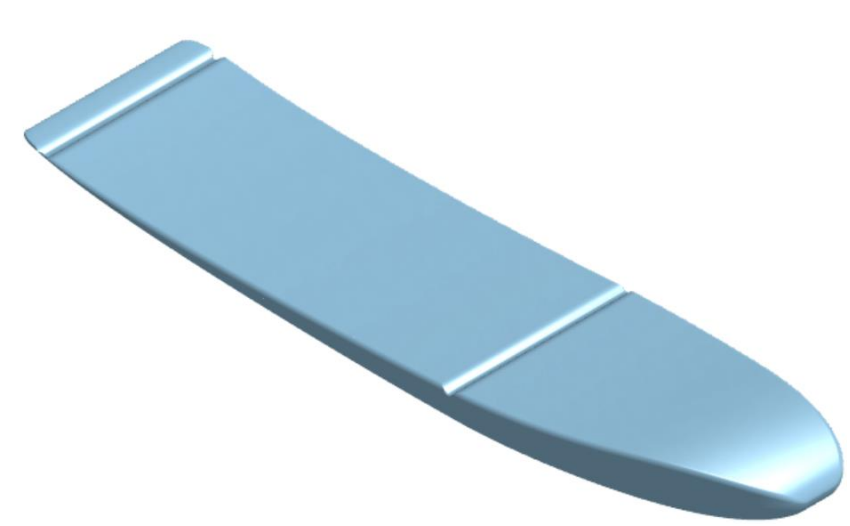
Several considerations were made for the glider design, such as the weight density of the wing materials, the center of mass location of the combined geometry, the increased support (weight) needed near the base of the wings for larger lift-induced moments, etc. The main factor of the design was in the wing geometry as this would be the main source of lift and weight which would most impact the overall vehicle dynamics. To achieve a longer flight range, it was calculated that the lift to drag ratio (L/D) should be maximized. With this in mind, the glider was designed as shown below.


The lifting surfaces of the glider are divided into the main wing set and the tail wing set; this was done to create a countering lift force to stabilize the pitch of the glider during flight. Each wing surface is constructed based on a truncated elliptical wing platform in order to minimize the induced drag and approach an ideal elliptical lift distribution desired. This is combatted by increasing the aspect ratio of both wing sets and the tips of each wing are given a large dihedral angle (i.e., winglet) to combat the induced drag as well.
The airfoil design was limited to NACA four-series airfoils as per the project constraints. As mentioned before, placing the center of lift closer to the fuselage of the glider greatly reduces the material needed to support the wings given the large lift moment (Mx) that would have been created with a more uniform lift distribution. Therefore, airfoils with higher camber were desired near the fuselage. Above, the airfoils used at the root (NACA6315) and tip (NACA5411) of the main wing set are compared using XFoil. In addition to this larger camber, a higher L/D ratio was desired which was dependent upon the range of angles of attack the glider was expected to be subjected to based on preliminary analysis. For each section of the main wing set, as well as the tail wing, the L/D ratio was maximized while setting the lift coefficient to the amount needed for the desired lift distribution. This process involved several iterations, but results could be computed as shown below to quantify this process.

The performance of the glider was computed first using XFoil to simulate the 2D flow over each wing section to optimize the airfoil selection, then through VSPAero (vortex lattice method flow solver in OpenVSP) to confirm the previous analysis as well as predict the overall lift and drag performance, then finally through SimScale to get the most accurate 3D simulation result. During the iteration process, XFoil and VSPAero were utilized to minimize computation time and to fine tune several of the design parameters such as the airfoil selection, wing dimensions, and wing posiitons. The results of the final glider design shown above were calculated via SimScale (k-omega SST turbulence model) as shown below.

Future iterations of the design were needed as shown by these simulation results. However, the overall design was optimized based on the unique conditions of the glider and the performance required. The tail wing position and orientation was strategically determined to utilize the deflected free stream flow from the main wing set (around 8 degrees) as well as to minimize the drag. Early onset flow seperation was noted in this design which can be improved by further optimizing the airfoil selection and main wing angle of attack to achieve the same lift required but with reduced seperation penalty. Overall, the glider was able to reach almost 100m (5s flight) with substantial lift across the flight.
This simulation involved creating 30,000 bodies, called "asteroids," in a 2-D plane to simulate their dynamics by gravitational attraction. The motion of each asteroid is determined using constructor functions for a class of asteroid objects in a Java environment (using Processing). The gravitational force and dynamics are determined using a vector sum of the remaining asteroids and determining the position each frame via Euler's method. The net result of the gravitational force and subsequent motion creates a frame of the video below at each small time step. A color temperature gradient is also applied to cause the slower moving asteroids to appear lighter and the faster moving asteroids to appear yellow.

This animation shows a high resolution zoom of a point near the edge of the Mandlebrot set. At each frame of the animation, the set of visible points are identified and are determined to be inside or out of the Mandlebrot set by using the characteristic equation. A maximum number of 10,000 iterations is used to determine this, and the amount of iterations needed for divergence is recorded in order to produce the color gradient shown below (the greyer colors meaning faster convergence). In the next frame, the dimensions are scaled to be centered around the target focal point and the entire process is repeated to create the next frame of the animation. In total, 189 frames are computed to create the animation sequence shown.

This project involved creating a custom messenger tote bag out of canvas drop cloth. The blue prints for the sewing pattern are shown below. The entire bag was cut and sewn by hand and features a laptop sleve, a water bottle pocket, two miscellaneous pockets, and pencil/pen holders. Attached to the bag is an adjustable strap and a hood fastened on by a wooden toggle closure fastener.

This project involved creating the architectural plans for the fence surrounding the property and constructing it. The project was half parts landscaping to clear room for the fence and the holes needed for the new posts, and half parts construction. Using the plans shown below, holes were dug around the perimeter of the fence for the concrete footers and each of the fence posts. Construction took approximately four days to complete.


This personal project created a choose your own adventure game, inspired by many text based adventure games in the golden age of video games and by Black Mirror: Bandersnatch. The game was created entirely by myself including all of the code (Java, processing), text prompts, map, in-game art, soundtrack, etc. Gameplay involves being presented a prompt of the players current position as well as two options to choose that traverse through the world. The objective of the game is to to reach the top of Mount Zenith and defeat the final boss seated at the summit; along the way various side questions and boss fights will require precise navigation, skill, and wits.
Click on the link below to download and play Zenith!

